


 SMT Prospects and Perspectives: AI Opportunities, Challenges, and Possibilities, Part 1
 Nolan’s Notes: Do More, Get More
 Global Sourcing Spotlight: Don’t Be Afraid of Global Sourcing
Color Logical Analysis Approach for LED Testing in Manufacturing
July 9, 2015 | Zhi-Min Shi and Yang Hua, Keysight TechnologiesEstimated reading time: 13 minutes
Traditional LED test includes two major tasks. 1. Development of the test program to drive LED ON/OFF. 2. Test execution in the production line. Test program development incurs a one-time cost for each type of device under test (DUT) and it is a challenging job. The engineer needs knowledge of the device under test (DUT), and skills in test development. LED test execution contains several steps: driving LED on, waiting for LED to reach a stable state, measuring LED, driving LED OFF. It would be ideal if we can save the effort of test development and time to run LED test in production.
In this case study, several PCB boards used for desktops and laptops were studied. The number of LEDs varies from 0 to 20. The studies showed opportunities for zero additional test development. 70% to 80% of the LEDs are lit at certain time during power-on test and functional test stages. Some LEDs are lit constantly. Some LEDs are turned ON or OFF according to time. The sampled ON and OFF forms a sequence of ON/OFF that provides information about not only whether LED is present, correct, and live, but also DUT functionality. This LED ON/OFF behavior presents an opportunity to have zero test development and zero extra test execution time.
PMCMF-CLA is a method to achieve LED coverage with zero additional LED ON/OFF test development and zero extra test execution time. PMCMF-CLA monitors multiple LEDs in parallel while other tests are running. Measurement of color (in terms of wavelength) and luminosity is recorded along with its sampled time. The sampled data forms color waveforms that can be analyzed for various test purposes. For example, an expected LED has red color with certain luminosity. When it is detected in a color waveform, the information indicates the LED is present, correct and live. Color waveform analysis can be run in parallel while the LED ON/OFF is monitored. Therefore, overall test execution time is almost the same as the test program that has no LED designated test.
Introduction
High volume PCB manufacturing is very sensitive to cost of test in the production line. The key test objective is to achieve high test coverage that may be measured by PCOLA/SOQ [1]. Test development efforts for a special PCB and test execution time in production are two of the factors that impact cost of test. Test development happens when a new product is about to be manufactured. Complexity of the product impacts how much effort is needed to develop the test program. Once a test program is developed, it is executed in the production line to verify product quality. The execution time of a test program has direct impact to the throughput of a production line. The faster the test program runs, the lower the cost of test would be.
Traditional LED test approaches contain two stages. The first is to develop a program, called test, to turn LED under test ON or OFF. The complexity of test depends on design of the PCB board to turn LED ON or OFF, and functionality provided by the test equipment, called the tester. To achieve quick time-to-market (TTM), it is desirable to generate such tests automatically. Usually, it is a challenge to generate it automatically due to the specialty of PCB design. Ways to save development effort are one of the topics discussed later. The second stage is test program execution. Usually LED test execution contains four steps.
- Run test to turn LED ON
- Wait for LED under test to reach stable state, i.e. desired color and brightness
- Measure LED color and brightness to decide whether the LED meets expected quality
- Run test to turn LED OFF
The time for the four steps varies from 3 seconds to 30 seconds [2]. Saving this execution time in high volume production is desired with discussion in this paper on cases where test execution time can be saved to reduce overall test execution time.
The following section discusses challenges in board level LED test. Then, several PCB boards are studied. A parallel multi-channel / multi-functional color logic analysis (PMCMF-CLA) is introduced. What PMCMF-CLA can cover and how it helps in reducing cost of test for high volume PCB manufacturing are also discussed.
Board Level LED Test Challenges
Two challenges are faced. One is the complexity of test program development. Another is test execution time.
The density of PCBAs is increasing due to an increasing number of devices added, while PCB size is decreasing due to the trend of compacting designs. Fewer and fewer test pads are available for manufacturing test. Without direct access to test pads to drive LED ON/OFF, the PCB design has to be studied carefully, such as board schematic, component data sheet, etc. For example, Figure 1 shows a commonly used circuit to control LED ON/OFF. To drive the LED, a special digital test program has to be developed. The digital test program controls the IC to pull the pin low or high to turn LED ON/OFF. Digital test development is complex. The data sheet of the IC needs to be studied thoroughly. Enough test pads must be available for the digital test, including any interference from neighboring components that needs to be highlighted. All these issues need to be studied carefully, and only then can the test program be developed and debugged. This entire process of studying, programming, and debugging takes time.
Figure 1: LED Control Circuit Example
If there is a test pad to drive LED ON/OFF, the current has to be controlled to safely drive LED ON/OFF without causing potential damage to any connected IC. In the case of Figure 1, current control is hard to drive LED ON/OFF to make sure that it does not harm the connected IC. To address all these concerns, a lot of time is needed. It impacts the Time-To-Production, a manufacturing criterion that is always required to be as short as possible. To make the situation more complicated, product design change frequently during a new product introduction. Therefore, LED test development is a time consuming, complex task.
As mentioned in the Introduction, traditional LED test has four steps: turning the LED ON, waiting for the LED to reach a stable state, measuring color and luminosity, and turning LED OFF.
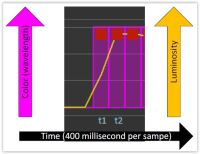
Figure 2 shows an experiment that records LED color and luminosity. Each measurement has one pair of data, color (in terms of wavelength) and brightness (in terms of luminosity). At time t1, red color is detected. But the luminosity is only half value of the value at time t2. A stable luminosity is at t2. Therefore, we need to wait at least 0.4 seconds before obtaining a stable measurement. This is a short delay for one LED test. But a typical high volume production line can assemble one hundred thousand products. That would cause a total of 40,000 seconds, or 666 minutes, or 11 hours. This test execution time is considered as one of test costs in production. It would be desirable to save this cost in the high volume production line.
Figure 2: LED color and luminosity changes while turning to LED ON
The following sections explore potential solutions to address the mentioned challenges.
Page 1 of 3
Share on:


Suggested Items
Stan Rak: Elevating the Ideas and Insights of IPC's Thought Leaders Program
04/25/2024 | Stanton Rak, SF Rak CompanyAs a member of the IPC Thought Leaders Program (TLP), I am responsible for identifying knowledge-sharing opportunities that can generate ideas and insights that strengthen the IPC community as well as create a sustainable and lasting future for its members. I am delighted to highlight some of my recent contributions as a member of the TLP.
Alternative Manufacturing Inc. Awarded QML Requalification to IPC J-STD-001 and IPC-A-610
04/24/2024 | IPCIPC's Validation Services Program has awarded an IPC J-STD-001 and IPC-A-610 Qualified Manufacturers Listing (QML) requalification to Alternative Manufacturing Inc (AMI).
IPC Design Competition Champion Crowned at IPC APEX EXPO 2024
04/24/2024 | IPCAt IPC APEX EXPO 2024 in Anaheim, California, five competitors squared off to determine who was the best of the best at PCB design.
Big Win for Defense Production Act Budget Allocation in FY24 Budget
04/23/2024 | I-Connect007 Editorial TeamOne year ago, President Biden issued a determination that chips and packaging are critical for national security. Since that time, much work has been done to continue the conversation in Washington, elevating the importance of the entire chips value chain, and including printed circuit boards and substrates, without which chips cannot operate.
Real Time with... IPC APEX EXPO 2024: A Conversation with IPC's CEO: New Venue, Sustainability, and More
04/23/2024 | Real Time with...IPC APEX EXPOBarry Matties hosts Dr. John W. Mitchell, CEO of IPC, on the final day of IPC APEX EXPO 2024. They discuss the new venue in Anaheim and broach a range of topics, from traffic and booth experiences to workforce development, sustainability, and the CHIPS Act. And they offer advice for newcomers as IPC looks forward to an even better show experience next year.