


 SMT Prospects and Perspectives: AI Opportunities, Challenges, and Possibilities, Part 1
 Nolan’s Notes: Do More, Get More
 Global Sourcing Spotlight: Don’t Be Afraid of Global Sourcing
Acceptance Testing Of Low-Ag Reflow Solder Alloys (Part 2)
August 13, 2015 | K. Troxel, A. Allen, E.E. Benedetto, R. Joshi, Hewlett-Packard Co.Estimated reading time: 7 minutes
In Part 2 of this two-part article series, the authors discussed the test results for low-silver alloys using these solder paste alloy assessment protocols for BGAs and leaded components, and the impact of the alloys on printed circuit assembly process windows.
Test Results and Discussion
Manufacturing DoE Results
IMC Thickness
Measured on BGA Manufacturing DoE Test Boards (see Figure 1 in Part 1) that were reflowed 3 times with a peak reflow temperature of 250 °C and 120 seconds TAL.
Two BGA body sizes were evaluated [14 mm and 23 mm]. IMC thicknesses for alloys A and B were normally distributed with no significant difference between the large and small BGA. For alloys C and D, greater variability in the large BGA IMC thickness resulted in values significantly different than smaller BGA (as seen in Figure 1 and Table 1).
Figure 1: IMC thickness distribution by Alloy (A-D) and BGA size (large/small)
Table 1: Summary of IMC thicknesses (microns)
Copper Dissolution
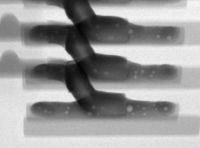
This was measured on the BGA Manufacturing DoE Test Boards (see Figure 1 in Part 1) that were reflowed 3 times with a peak reflow temperature of 250°C and 120 seconds TAL.
Cu thickness measurements were made at each solder joint, in the middle of the joint and underneath the soldermask adjacent to the joint. Cu removed was the difference in copper thickness at these two locations. Cu dissolved was determined by subtracting Epsilon (thickness of Cu removed during soldermask etch in the PCB fab process) from the Cu removed values.
Figure 2: Cu dissolution distribution by alloy
Table 2: Summary of Cu dissolved (microns)
The amount of Cu dissolved after soldering was less for the low silver alloys than that for SAC305. The Cu dissolution results were normally distributed for the evaluated alloys but varied with alloy and BGA size (as seen in Figure 2 and Table 2). The Cu dissolution performance varied by BGA size, though not in a consistent fashion. While alloy B showed comparable Cu dissolved values between the 2 BGA sizes, alloy C and D both had more Cu dissolved for the larger BGA while alloy A had greater Cu dissolution values for the small BGA (this could be attributable to bare board Cu characteristics between the different vendors).
Page 1 of 3
Share on:


Suggested Items
Taiyo Circuit Automation Installs New DP3500 into Fuba Printed Circuits, Tunisia
04/25/2024 | Taiyo Circuit AutomationTaiyo Circuit Automation is proud to be partnered with Fuba Printed Circuits, Tunisia part of the OneTech Group of companies, a leading printed circuit board manufacturer based out of Bizerte, Tunisia, on their first installation of Taiyo Circuit Automation DP3500 coater.
Vicor Power Orders Hentec Industries/RPS Automation Pulsar Solderability Testing System
04/24/2024 | Hentec Industries/RPS AutomationHentec Industries/RPS Automation, a leading manufacturer of selective soldering, lead tinning and solderability test equipment, is pleased to announce that Vicor Power has finalized the purchase of a Pulsar solderability testing system.
AIM Solder’s Dillon Zhu to Present on Ultraminiature Soldering at SMTA China East
04/22/2024 | AIMAIM Solder, a leading global manufacturer of solder assembly materials for the electronics industry, is pleased to announce that Dillon Zhu will present on the topic: Ultraminiature Soldering: Techniques, Technologies, and Standards at SMTA China East. This event is being held at the Shanghai World Expo Exhibition & Convention Center from April 24-25.
AIM to Highlight NC259FPA Ultrafine No Clean Solder Paste at SMTA Wisconsin Expo & Tech Forum
04/18/2024 | AIMAIM Solder, a leading global manufacturer of solder assembly materials for the electronics industry, is pleased to announce its participation in the upcoming SMTA Wisconsin Expo & Tech Forum taking place on May 7 at the Four Points by Sheraton | Milwaukee Airport, in Milwaukee, Wisconsin.
Hentec/RPS Publishes an Essential Guide to Selective Soldering Processing Tech Paper
04/17/2024 | Hentec Industries/RPS AutomationHentec Industries/RPS Automation, a leading manufacturer of selective soldering, lead tinning and solderability test equipment, announces that it has published a technical paper describing the critical process parameters that need to be optimized to ensure optimal results and guarantee the utmost in end-product quality.